2.10 Heart Rate Monitor with Chart
Visualise your pulse as a real-time scrolling waveform on an LVGL chart.
Overview
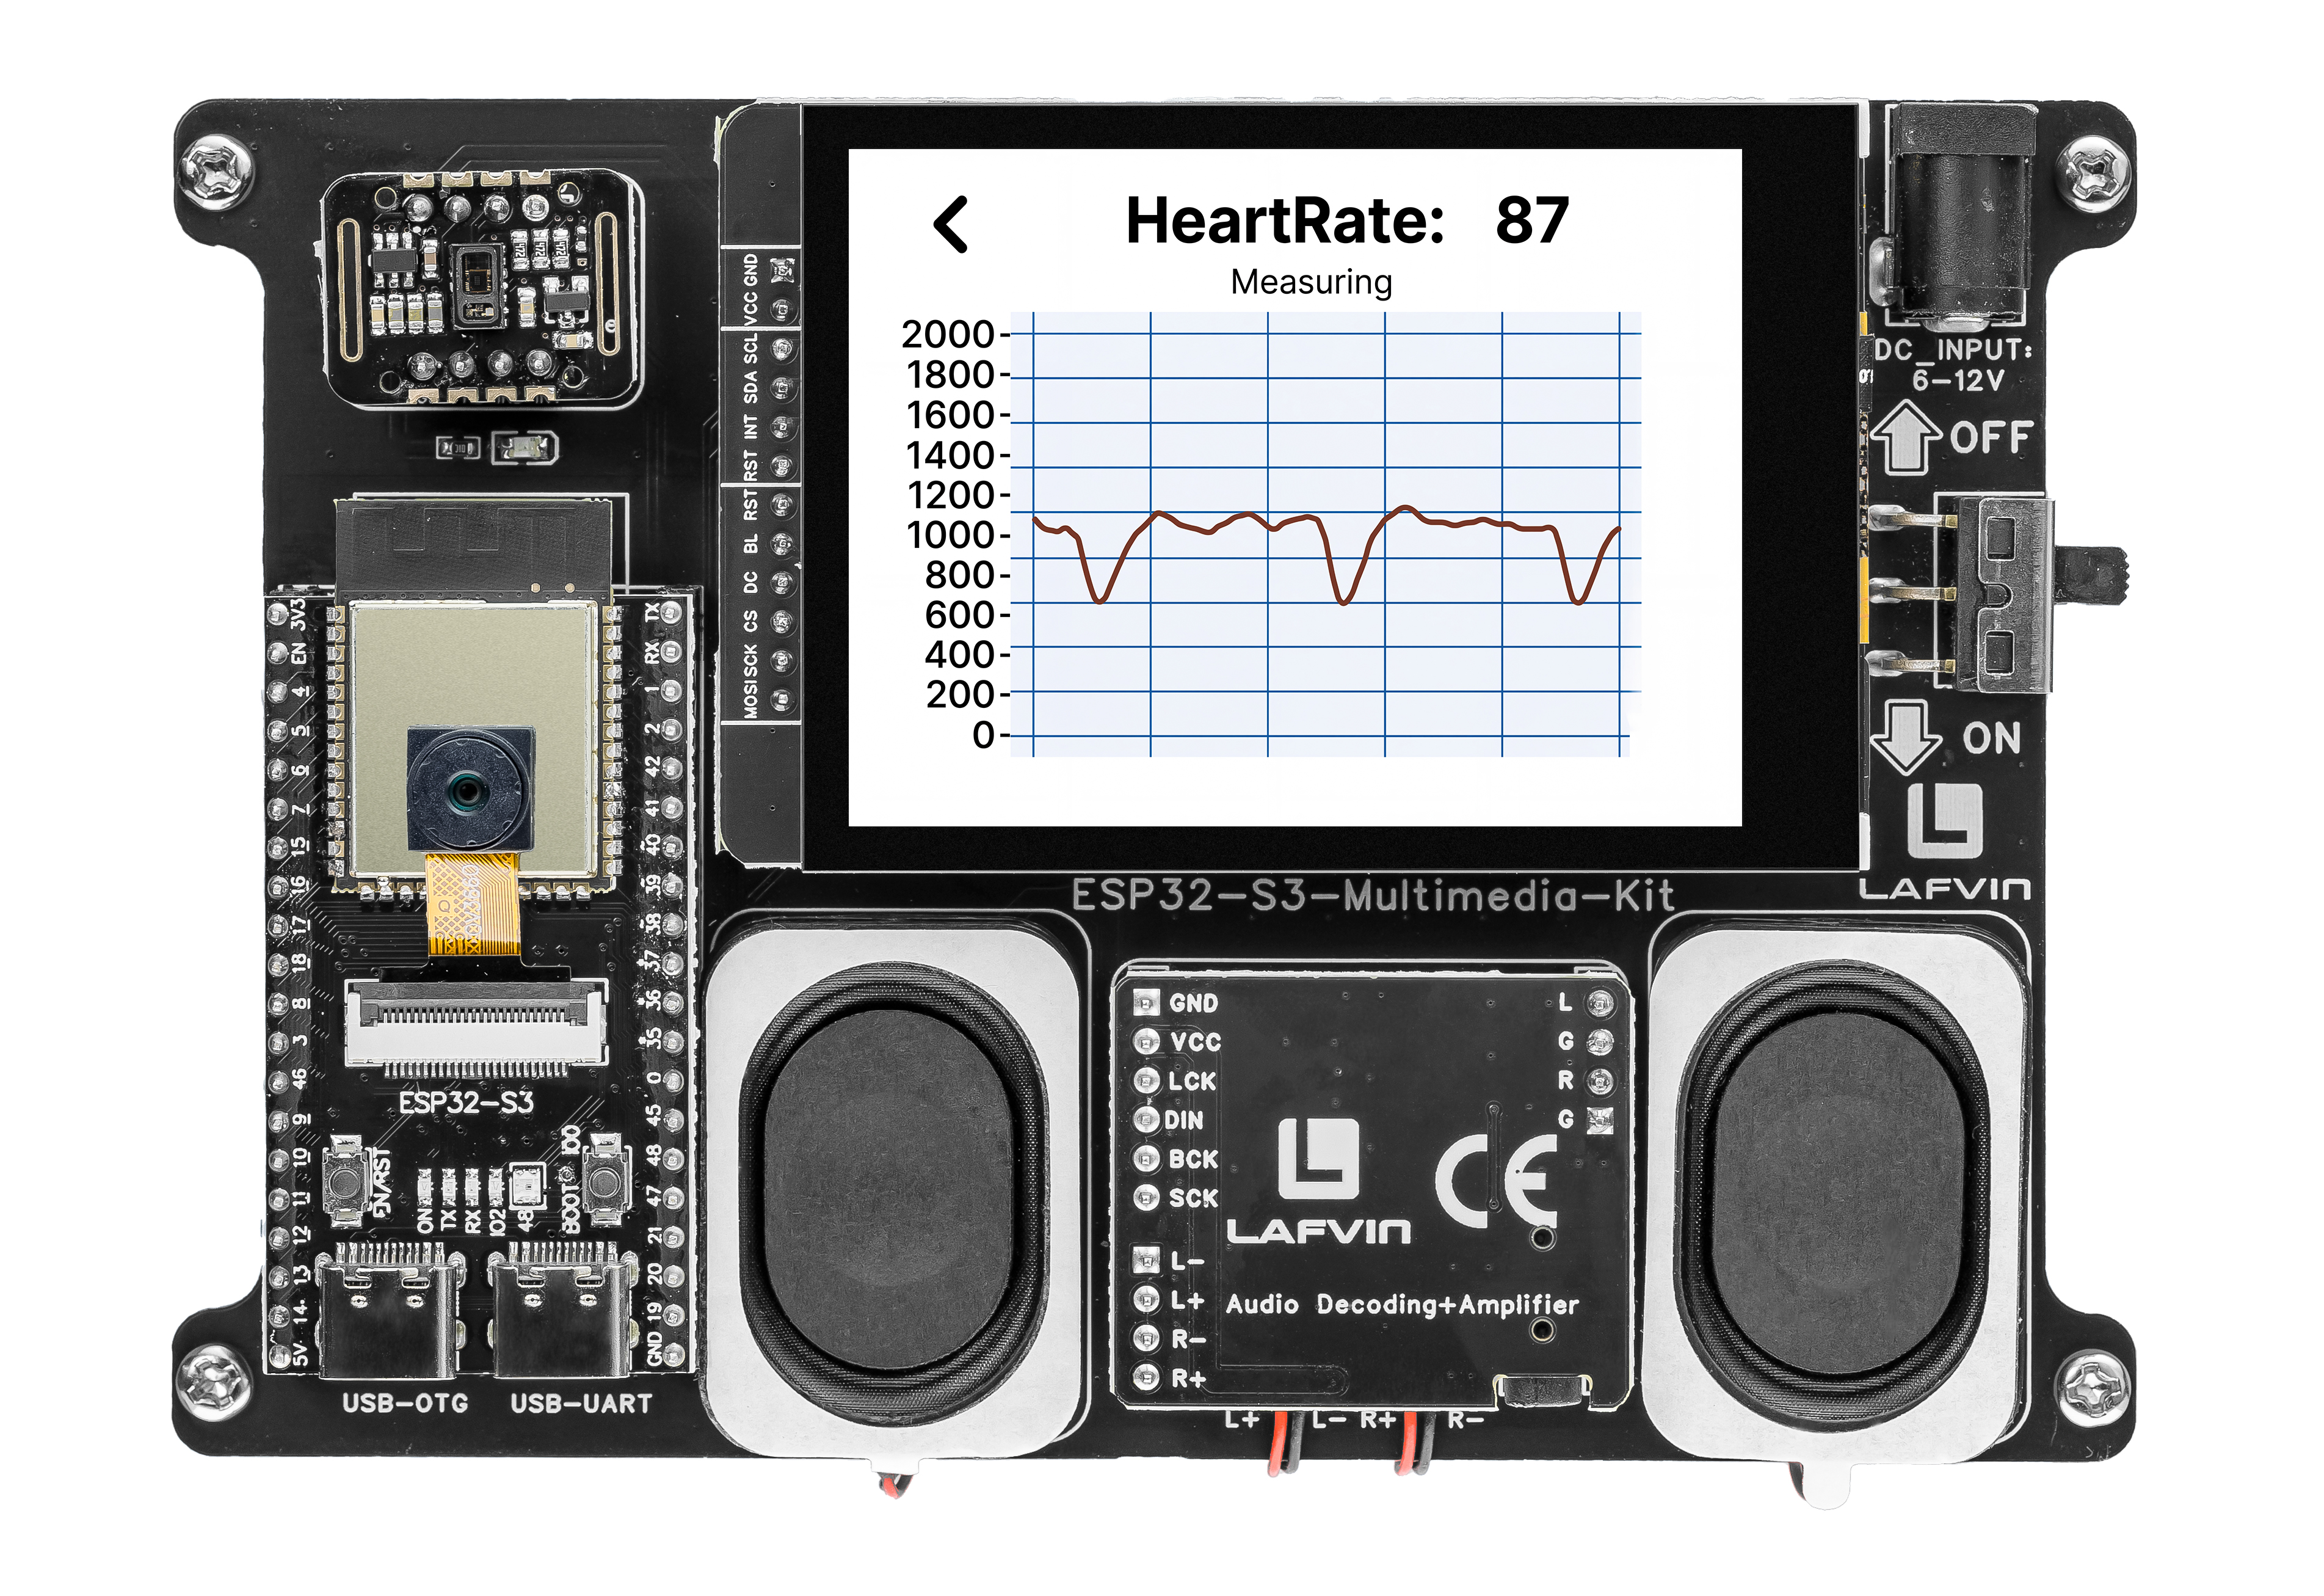
This example creates a medical-style heart rate monitor. IR data from the MAX30102 sensor is plotted as a scrolling line chart, while the computed BPM is shown in a large text label — all updated in real time.
What You’ll Learn
Creating and configuring an LVGL chart widget (
lv_chart)Adding data series to a scrolling line graph
Visualising real-time sensor data
Displaying computed values (BPM) above the waveform
Before You Begin
Complete the setup steps in Preparation before continuing.
Note
Use the recommended Arduino IDE settings in Recommended Board Settings unless this lesson says otherwise.
Open the example sketch from the code package:
LAFVIN-ESP32-S3-Multimedia-Kit-main/2.LVGL/10_LVGL_Heartrate/10_LVGL_Heartrate.ino
Signal |
ESP32-S3 |
|---|---|
SDA |
GPIO 2 |
SCL |
GPIO 1 |
Upload and Test
Connect the board with a USB Type-C data cable.
Open
10_LVGL_Heartrate.inoin Arduino IDE.In the Tools menu, select
ESP32S3 Dev Moduleas the board and choose the correct serial port.Click Upload.
The screen shows:
A scrolling red line chart (90 data points)
A numeric pulse reading (e.g., “72”) at the top-right
A status label — “Place finger”, “Detecting pulse…”, or “Measuring”
Gently place your fingertip on the MAX30102 sensor. The chart begins scrolling and the BPM number updates after a few seconds. Keep your finger still for the most accurate reading.
How the Code Works
The heart rate logic is mainly implemented in hartrate_ui.cpp.
Sensor Initialisation
The MAX30102 sensor is initialised on the same I2C bus as the touch panel (SDA=2, SCL=1). The init_sensor() function calls particleSensor.setup(), puts the sensor into low-power mode, seeds the waveform history, and resets the chart to a flat baseline.
void init_sensor(void) {
  Serial.println("Initializing MAX30102...");
  Wire.begin(HEARTRATE_I2C_SDA, HEARTRATE_I2C_SCL);

  if (!particleSensor.begin(Wire, I2C_SPEED_FAST)) {
    s_sensor_ready = false;
    update_status(HeartrateStatus::SensorError);
    Serial.println("MAX30102/MAX30105 was not found. Please check wiring and power.");
    return;
  }

  particleSensor.setup();
  heartrate_shutdown();

  reset_measurement_state();
  seed_wave_history(0);
  reset_chart();

  s_sensor_ready = true;
  update_status(HeartrateStatus::PlaceFinger);
  Serial.println("MAX30102 ready.");
}
Chart Setup
The scrolling waveform is an LVGL line chart with 90 data points. The Y-axis range and tick marks are configured via CHART_LOW_LIMIT / CHART_HIGH_LIMIT, and the series is pre-filled with a mid-range baseline value.
lv_chart_set_type(ui->chart, LV_CHART_TYPE_LINE);
lv_chart_set_update_mode(ui->chart, LV_CHART_UPDATE_MODE_SHIFT);
lv_chart_set_point_count(ui->chart, CHART_POINT_COUNT);
lv_chart_set_div_line_count(ui->chart, 10, 6);
lv_obj_set_style_size(ui->chart, 0, LV_PART_INDICATOR);

lv_chart_set_axis_tick(ui->chart, LV_CHART_AXIS_PRIMARY_Y, 3, 3, 11, 1, true, 42);
lv_chart_set_axis_tick(ui->chart, LV_CHART_AXIS_PRIMARY_X, 0, 0, 0, 0, false, 0);
lv_chart_set_range(ui->chart, LV_CHART_AXIS_PRIMARY_Y, CHART_LOW_LIMIT, CHART_HIGH_LIMIT);

s_chart_series = lv_chart_add_series(ui->chart, lv_color_hex(0xE55454), LV_CHART_AXIS_PRIMARY_Y);
lv_chart_set_all_value(ui->chart, s_chart_series, kChartMidpoint);
The Sampling Loop
A dedicated FreeRTOS task runs the measurement loop. It reads raw IR values, detects finger presence against a threshold (kFingerDetectThreshold = 50000), and calls checkForBeat() from the MAX30105 library. When a beat is detected, the BPM is averaged over a 4-sample sliding window.
const long ir_value = particleSensor.getIR();
s_last_ir_value = ir_value;

if (ir_value < kFingerDetectThreshold) {
  if (s_finger_present) {
    s_finger_present = false;
    reset_measurement_state();
    seed_wave_history(0);
    queue_chart_reset();
    update_status(HeartrateStatus::PlaceFinger);
  }
  vTaskDelay(pdMS_TO_TICKS(100));
  continue;
}

if (!s_finger_present) {
  s_finger_present = true;
  reset_measurement_state();
  seed_wave_history(ir_value);
  queue_chart_reset();
  update_status(HeartrateStatus::DetectingPulse);
}

if (checkForBeat(ir_value)) {
  const long delta = millis() - s_last_beat_ms;
  s_last_beat_ms = millis();
  s_beats_per_minute = 60.0f / (delta / 1000.0f);

  if (s_beats_per_minute < 255.0f && s_beats_per_minute > 50.0f) {
    s_rates[s_rate_spot++] = static_cast<byte>(s_beats_per_minute);
    s_rate_spot %= kRateSize;

    int beat_avg = 0;
    for (uint8_t i = 0; i < kRateSize; ++i) {
      beat_avg += s_rates[i];
    }
    s_beat_average = beat_avg / kRateSize;
    update_status(HeartrateStatus::Measuring);
  }
}
The raw IR value is smoothed by subtracting a 10-sample moving average, scaled by kWaveformGain, and centred on the chart midline. The result is queued for the UI loop via queue_chart_value().
Updating the Display
Chart values are applied in the UI loop through apply_pending_chart_updates() to keep LVGL calls on the same thread. The refresh_ui() function updates the BPM label — showing "--" when there is a sensor error, no finger, or the beat average is zero.
void apply_pending_chart_updates(void) {
  if (s_chart_reset_pending) {
    s_chart_reset_pending = false;
    reset_chart();
  }

  if (!s_chart_value_pending) {
    return;
  }

  s_chart_value_pending = false;
  if (s_chart_series != nullptr && g_heartrate_ui.chart != nullptr) {
    lv_chart_set_next_value(g_heartrate_ui.chart, s_chart_series, s_pending_chart_value);
  }
}

void refresh_ui(void) {
  if (g_heartrate_ui.status_label != nullptr) {
    lv_label_set_text(g_heartrate_ui.status_label, status_text(s_status));
  }

  if (g_heartrate_ui.bpm_label == nullptr) {
    return;
  }

  if (s_status == HeartrateStatus::SensorError ||
      s_status == HeartrateStatus::PlaceFinger ||
      s_beat_average == 0) {
    lv_label_set_text(g_heartrate_ui.bpm_label, "--");
  } else {
    lv_label_set_text_fmt(g_heartrate_ui.bpm_label, "%d", s_beat_average);
  }
}
In the provided sketch:
status_text()maps theHeartrateStatusenum to four human-readable labels:"Sensor error","Place finger","Detecting pulse...", and"Measuring"The chart auto-scrolls via
LV_CHART_UPDATE_MODE_SHIFT— each new data point pushes old data to the leftA dedicated FreeRTOS task (stack 8192 bytes) runs the sampling loop, while LVGL updates stay on the main thread
Try This Next
Open Arduino IDE’s Serial Plotter alongside the screen to compare graphs
Increase
lv_chart_set_point_count()for a longer waveform historyChange the chart from
LV_CHART_TYPE_LINEtoLV_CHART_TYPE_BAR